
Landscape iQ
One Tool for Payer Intelligence
- Size Opportunity With More Precision: Go beyond total lives with ASO, fully insured, LIS, plan, formulary, and geographic detail to size accounts more accurately and know where to focus.
- Target Based on Access Influence: See how payers, GPOs, PBMs, MCOs, and more organizations connect to understand who shapes access and where to focus your engagement.
- Get to the “Why” Behind Market Shifts Faster: Track 24 months of enrollment and market history, then use AI-powered insights to surface what changed, why it matters, and what deserves attention.
- Turn Payer Intelligence Into Account Advantage: Prioritize the right accounts, sharpen your strategy, and prepare for more informed payer conversations.
Understand Payer Relationships at a Granular Level
Uncover More Opportunity with ASO Lives
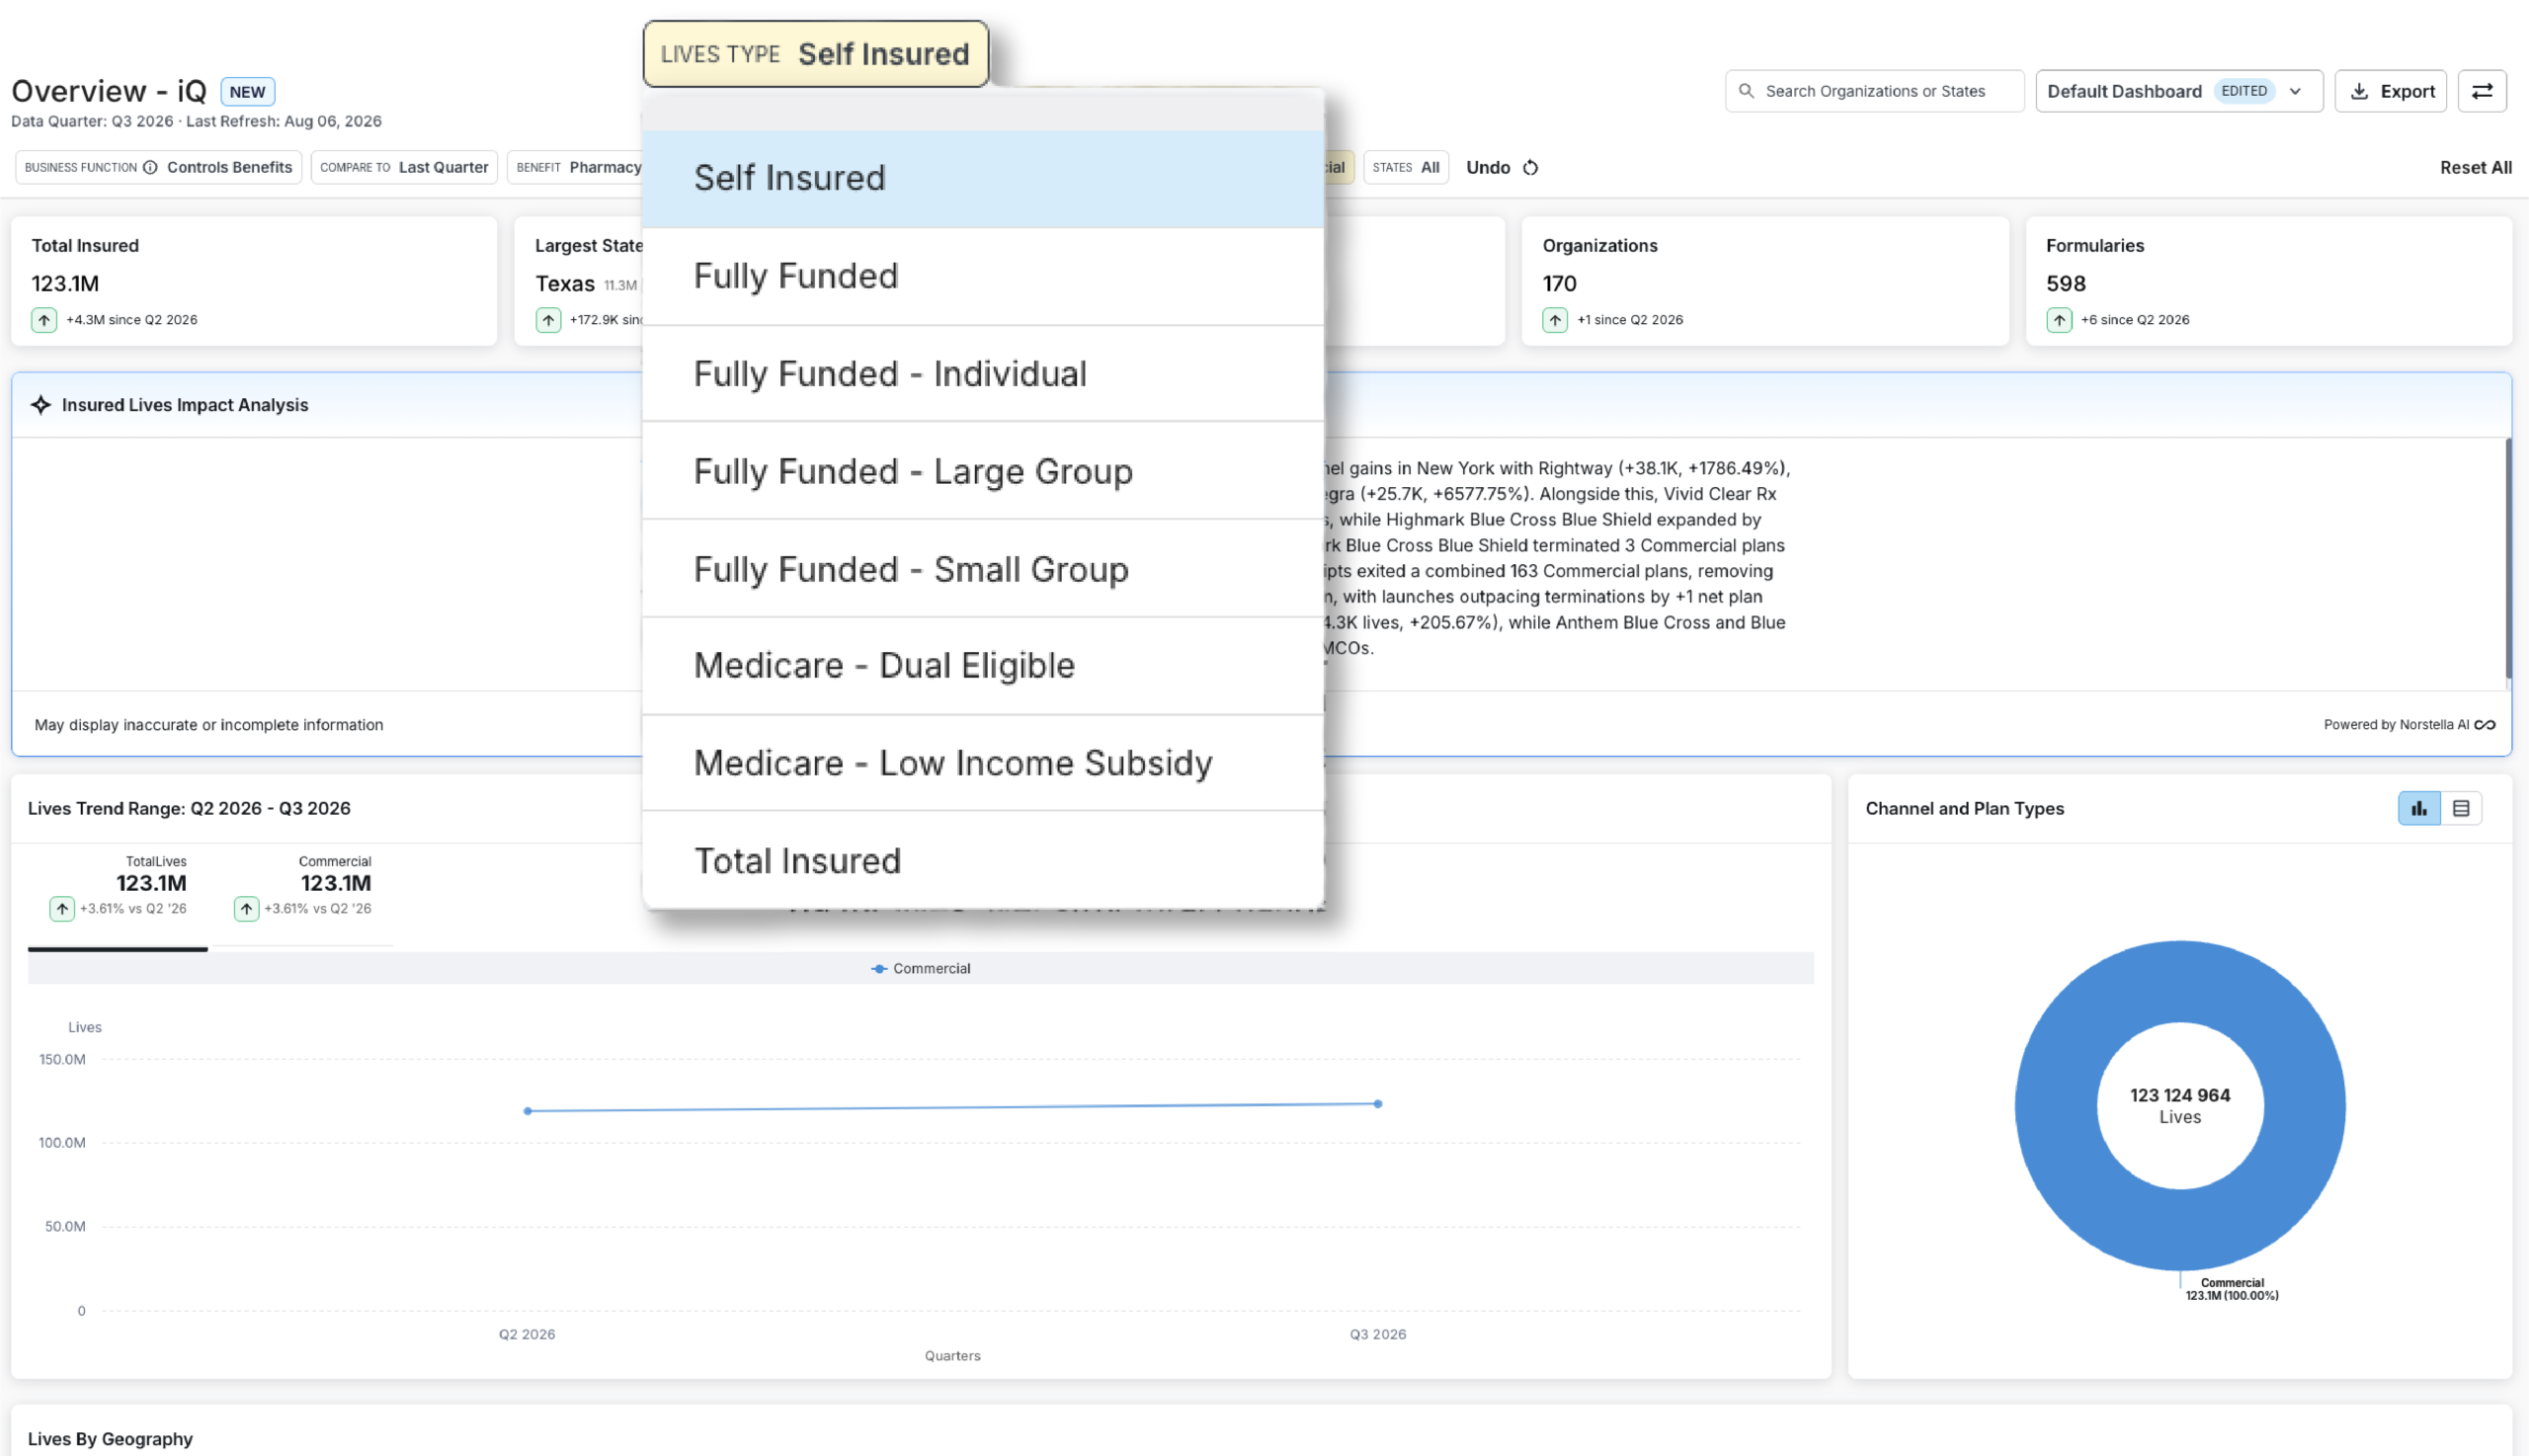
See ASO, fully insured, and LIS lives separately to better understand how your market is funded and where opportunity sits.
Break out ASO, fully insured, Low-Income Subsidy, and Dual Eligible lives to understand the enrollment mix behind an account or geography.
Move beyond total lives to see where opportunity is concentrated and how to engage an account or market.
See GPOs and More of the Organizations Shaping Access
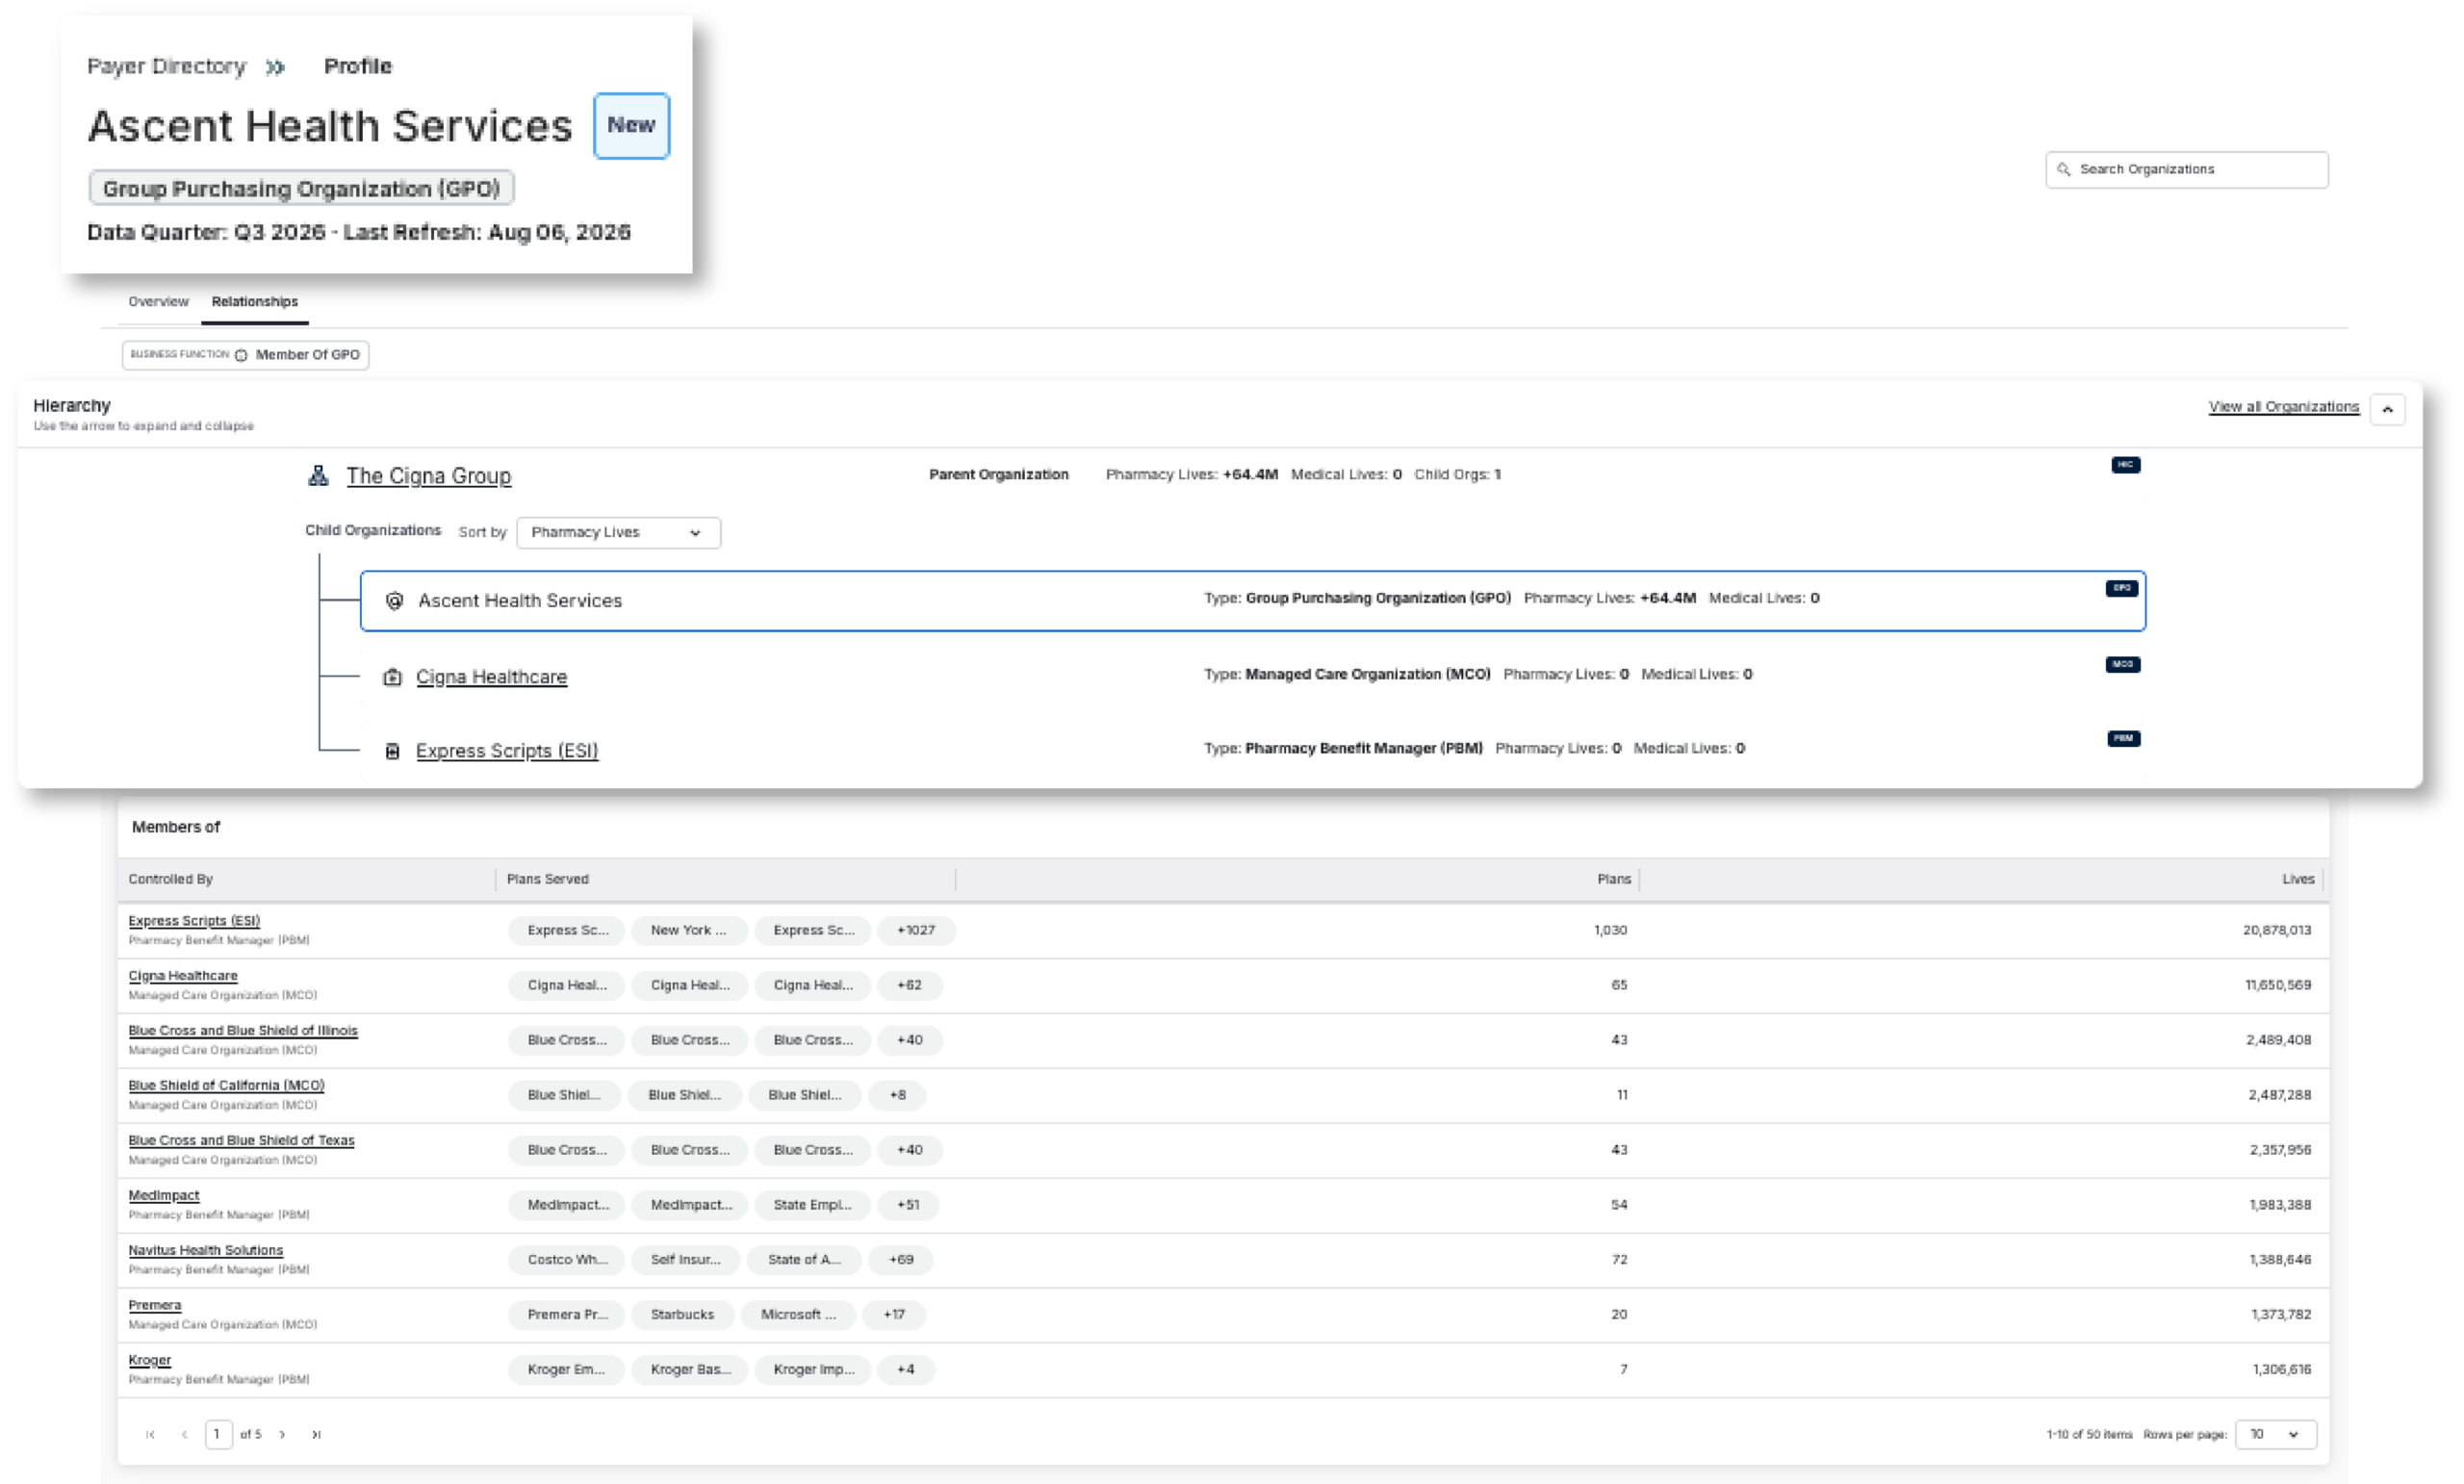
See how GPOs, PBMs, MCOs, payers, and other organizations connect, what roles they play, and where influence sits across the market.
Go beyond traditional payer views with visibility into GPOs and other organizations influencing access decisions.
Use business function filters to quickly see who offers plans, controls benefits, and plays other key roles across the market.
Explore hierarchy and relationship views to understand how organizations connect and where influence may be driving access decisions.
Go From County to Plan-Level Access
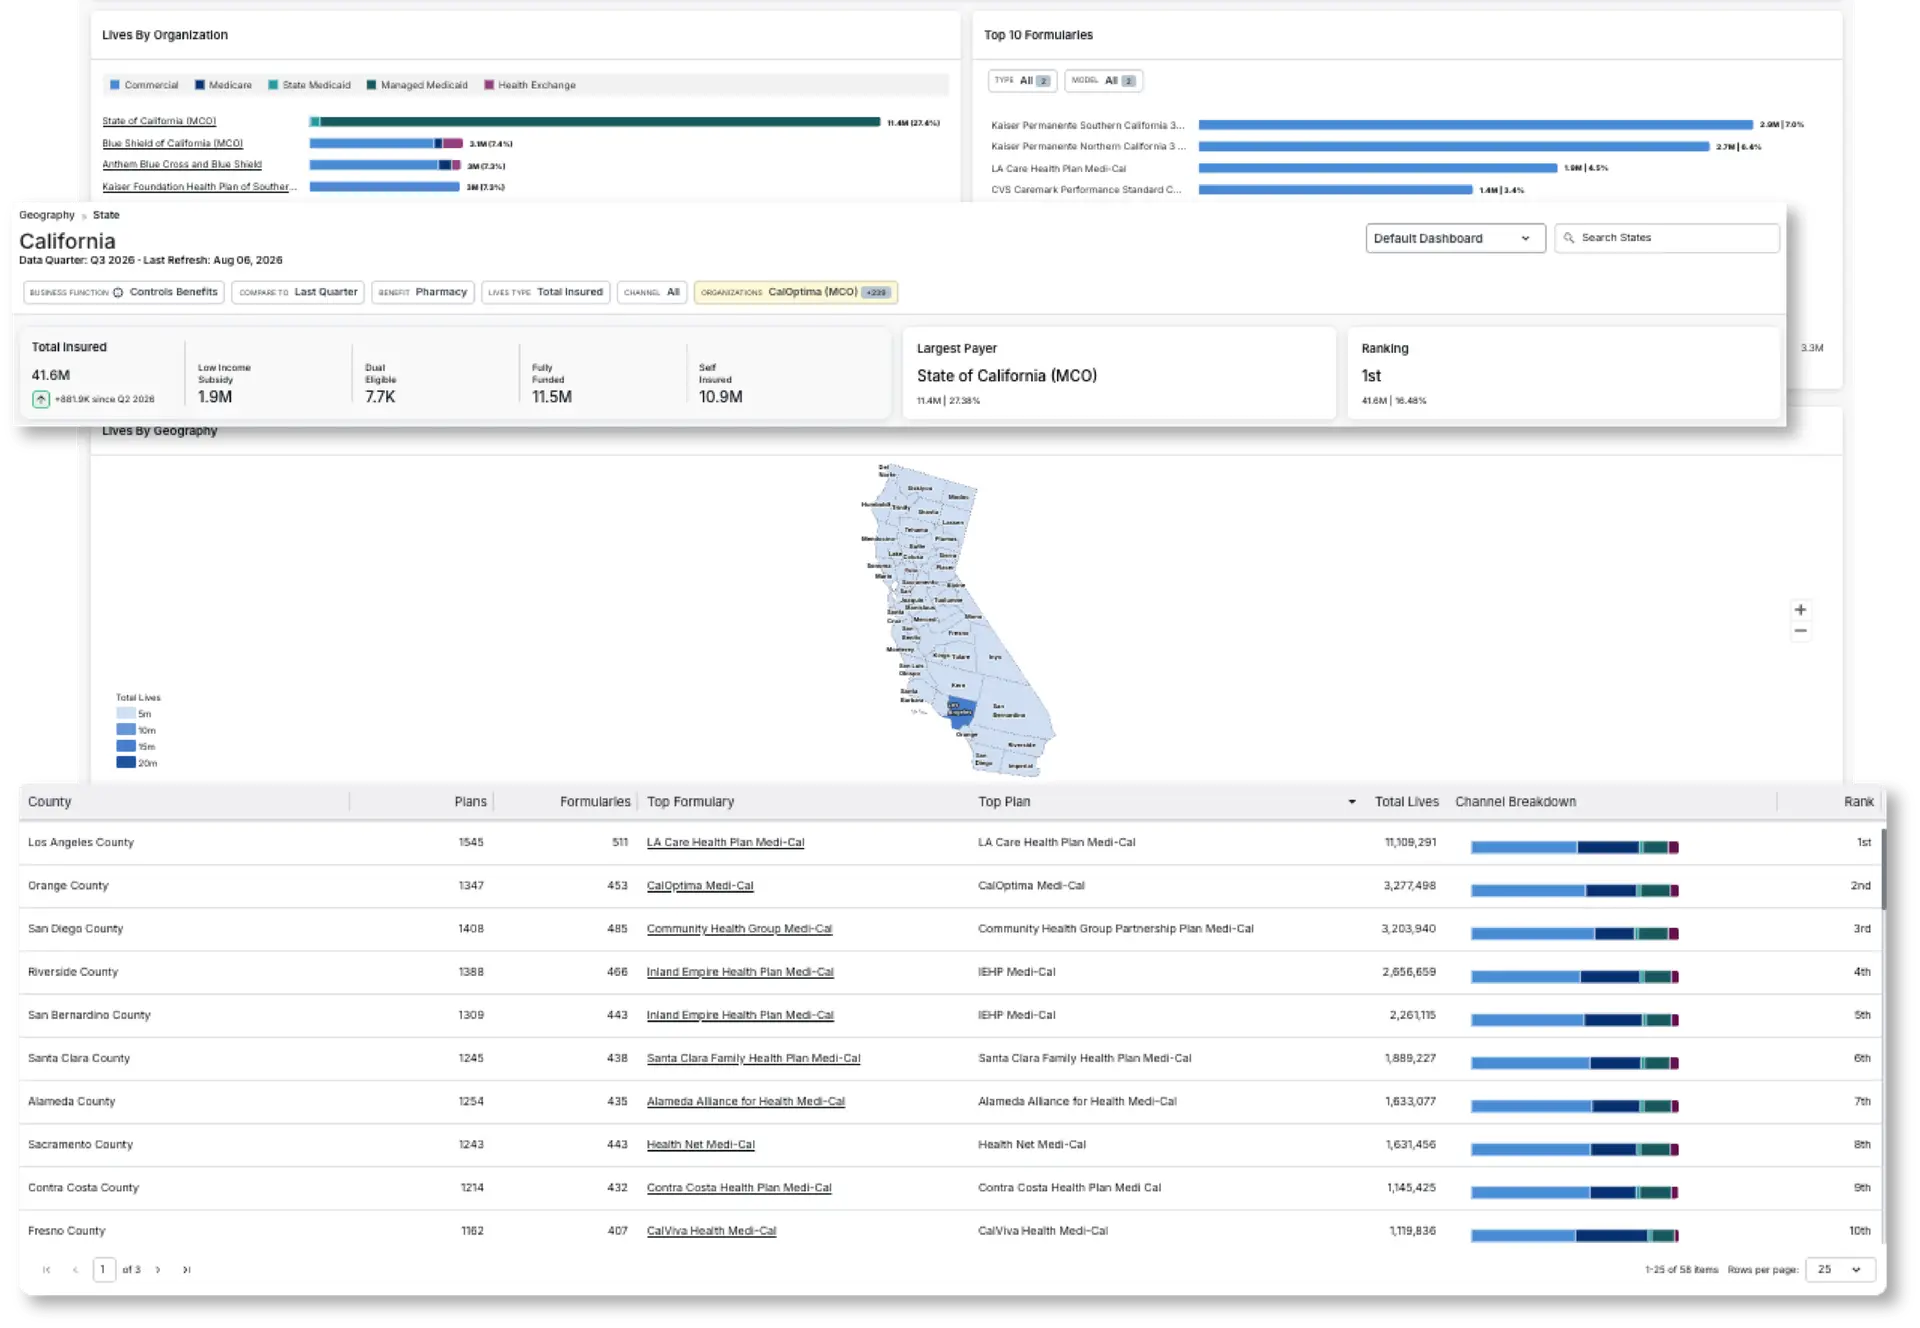
Geography views bring local market, plan, and formulary detail together to capture access differences and support stronger account planning.
See payer, enrollment, and market dynamics at the county level to understand how conditions differ across the markets you cover.
Connect geography with plan and formulary detail to tailor account plans to the access dynamics in each market.
Track 24 Months of Trends with Ella AI
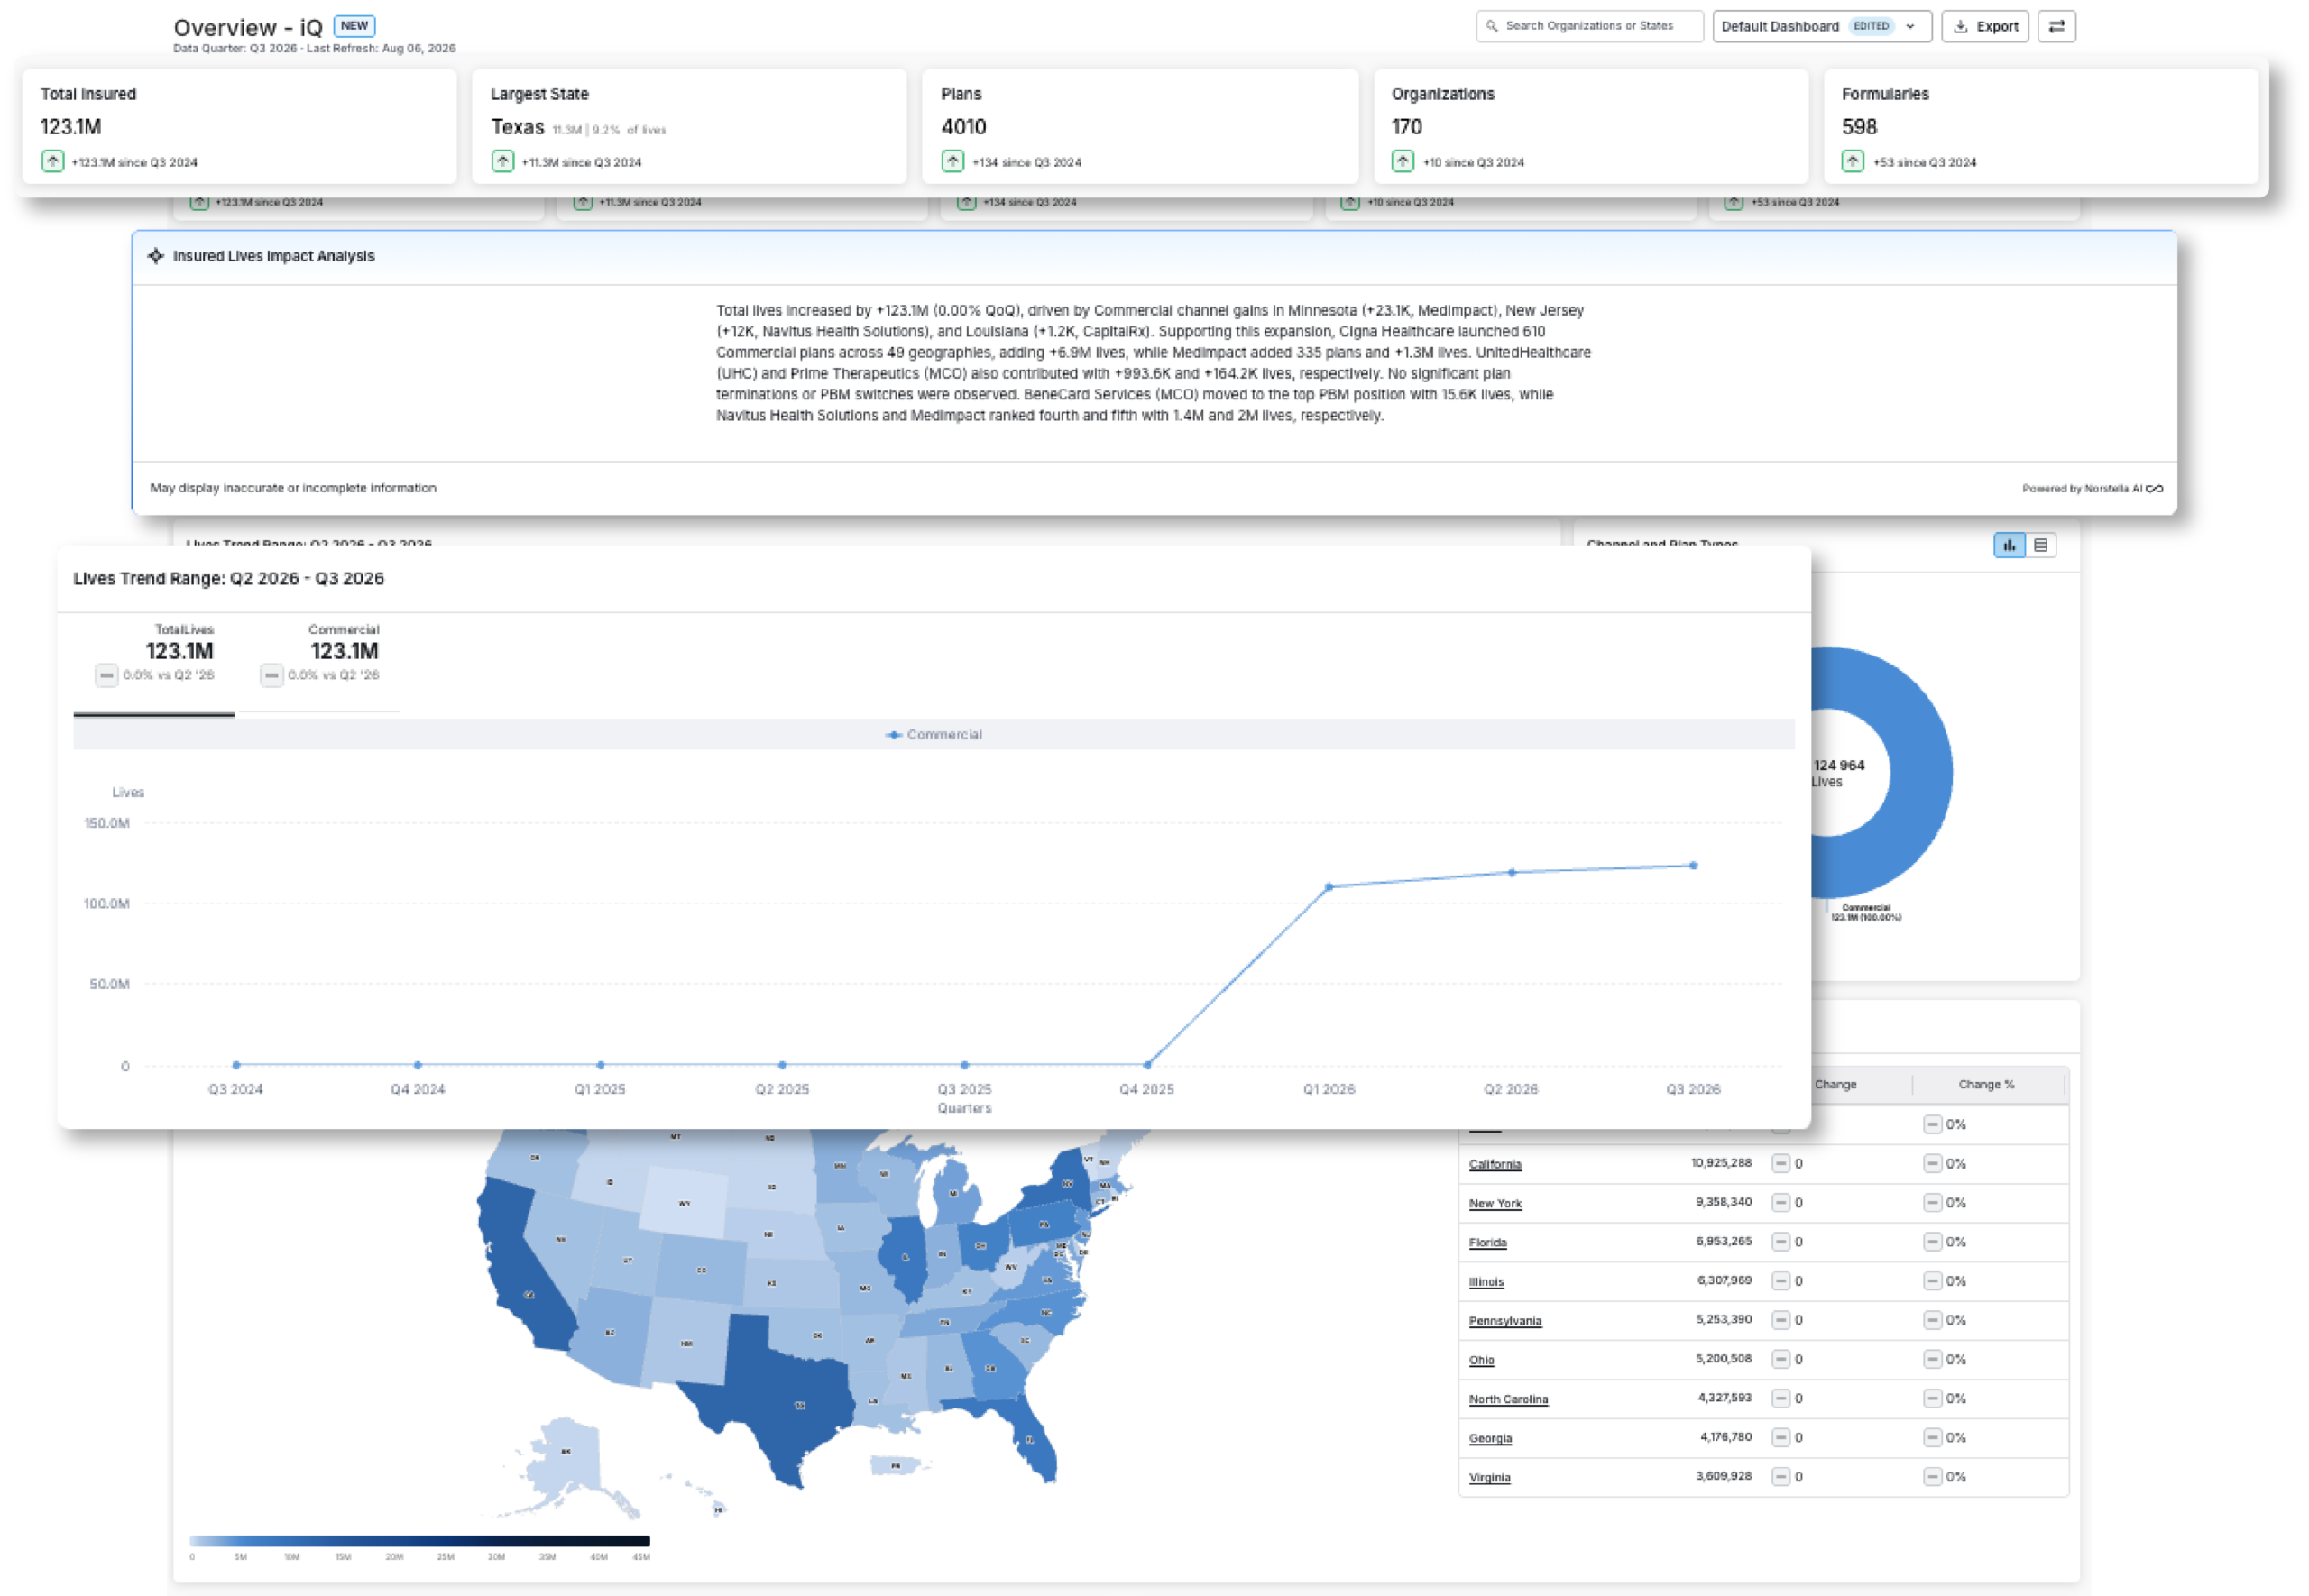
See how enrollment and market dynamics change over time, then use Ella AI to quickly understand what’s driving the shifts for an account or territory.
Track 24 months of history to see where enrollment, accounts, or markets are growing, declining, or shifting.
Use AI-powered summaries to surface the context behind market changes without piecing the story together across multiple data sources.
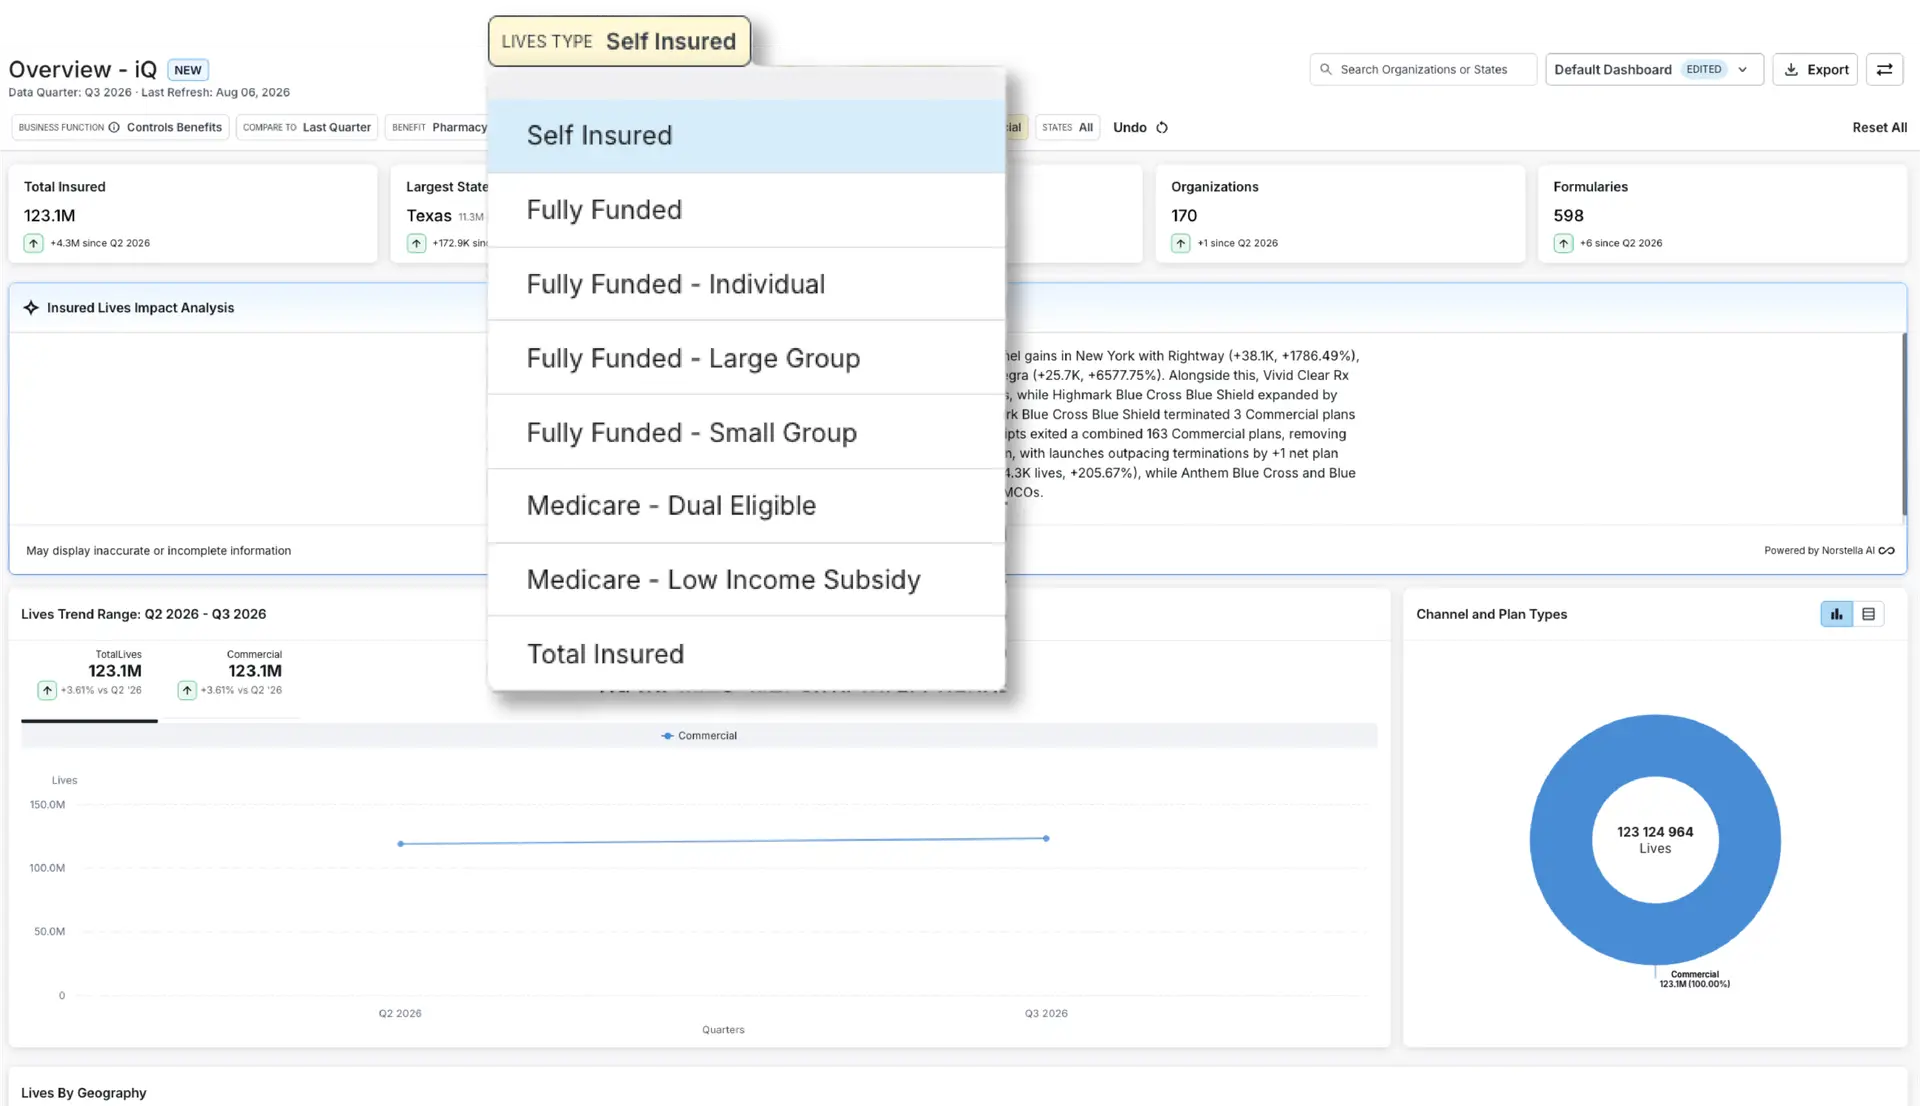
Uncover More Opportunity with ASO Lives
See ASO, fully insured, and LIS lives separately to better understand how your market is funded and where opportunity sits.
Break out ASO, fully insured, Low-Income Subsidy, and Dual Eligible lives to understand the enrollment mix behind an account or geography.
Move beyond total lives to see where opportunity is concentrated and how to engage an account or market.
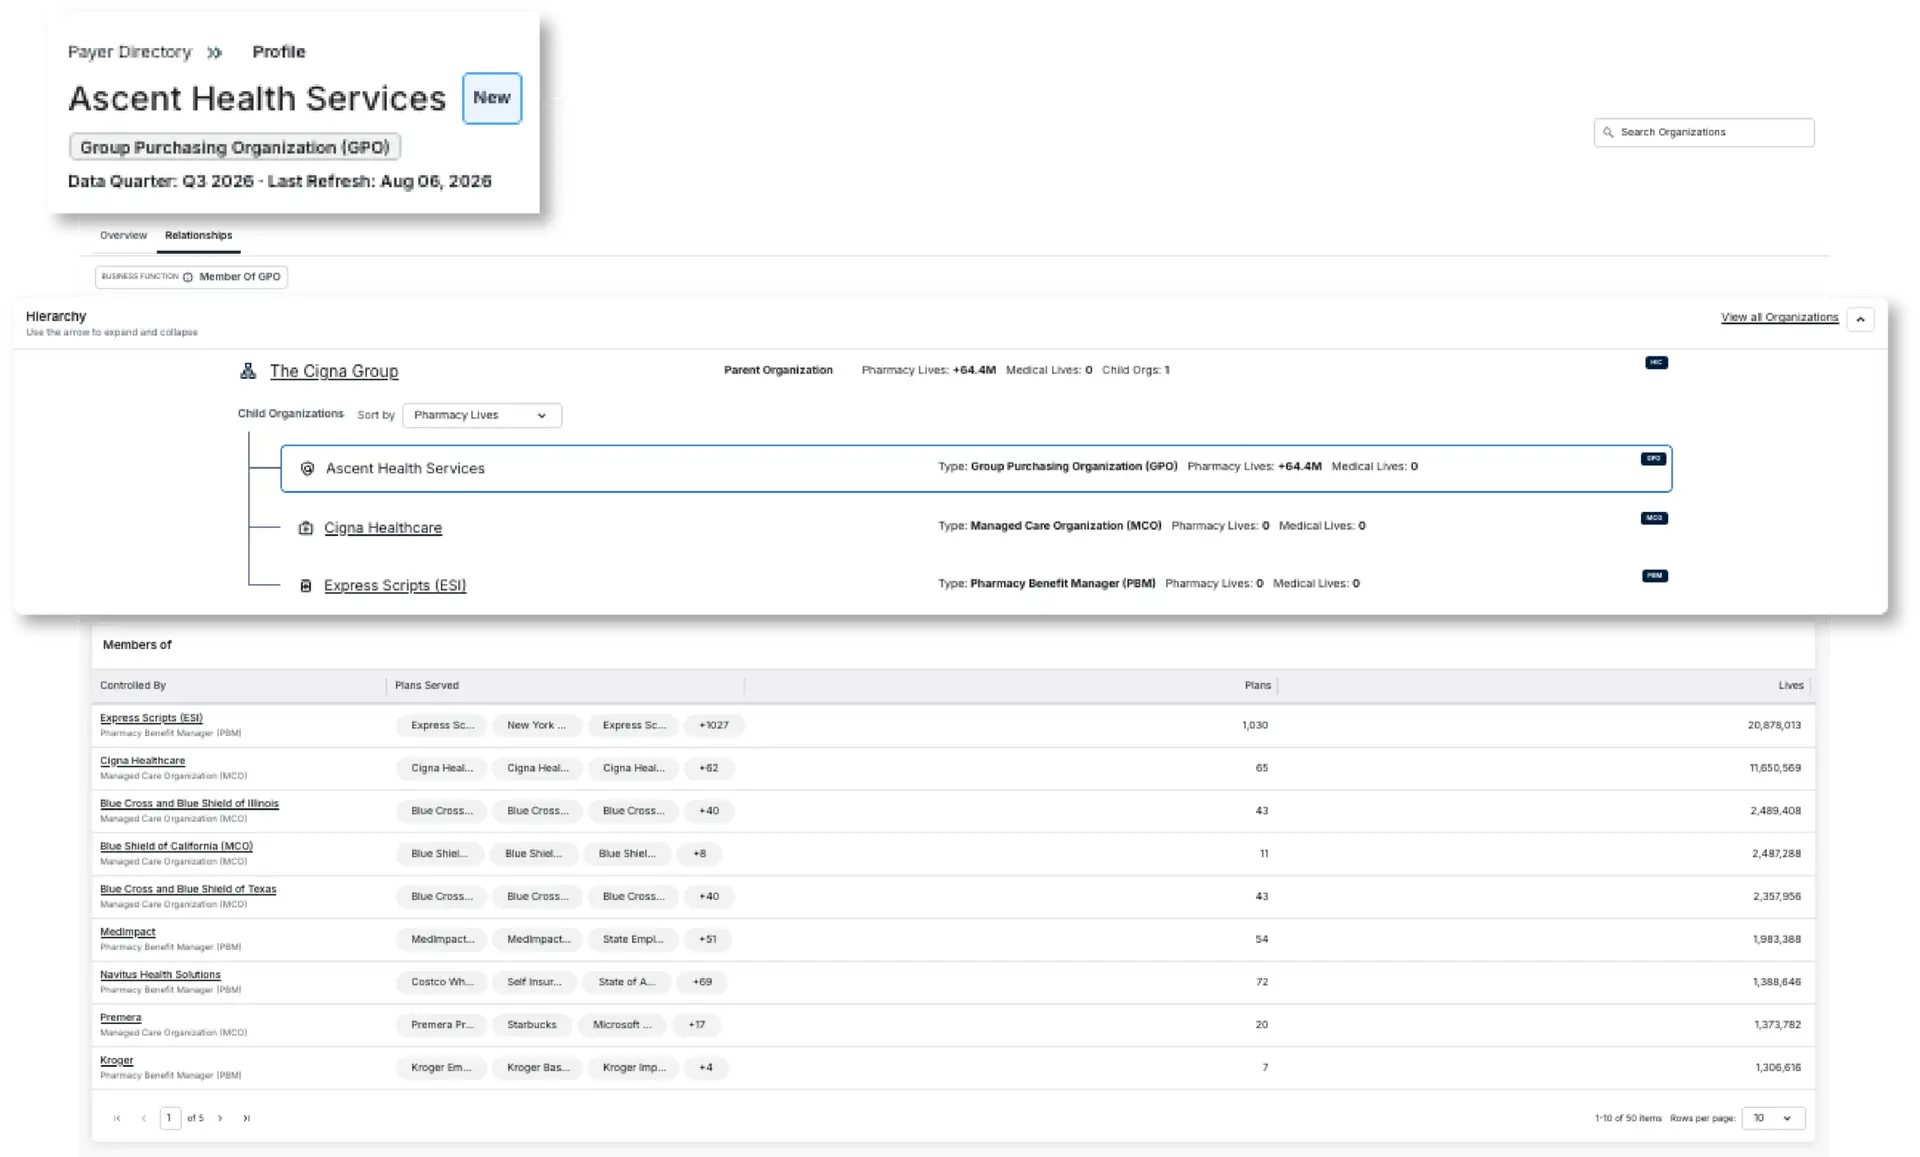
See GPOs and More of the Organizations Shaping Access
See how GPOs, PBMs, MCOs, payers, and other organizations connect, what roles they play, and where influence sits across the market.
Go beyond traditional payer views with visibility into GPOs and other organizations influencing access decisions.
Use business function filters to quickly see who offers plans, controls benefits, and plays other key roles across the market.
Explore hierarchy and relationship views to understand how organizations connect and where influence may be driving access decisions.
Go From County to Plan-Level Access
Geography views bring local market, plan, and formulary detail together to capture access differences and support stronger account planning.
See payer, enrollment, and market dynamics at the county level to understand how conditions differ across the markets you cover.
Connect geography with plan and formulary detail to tailor account plans to the access dynamics in each market.
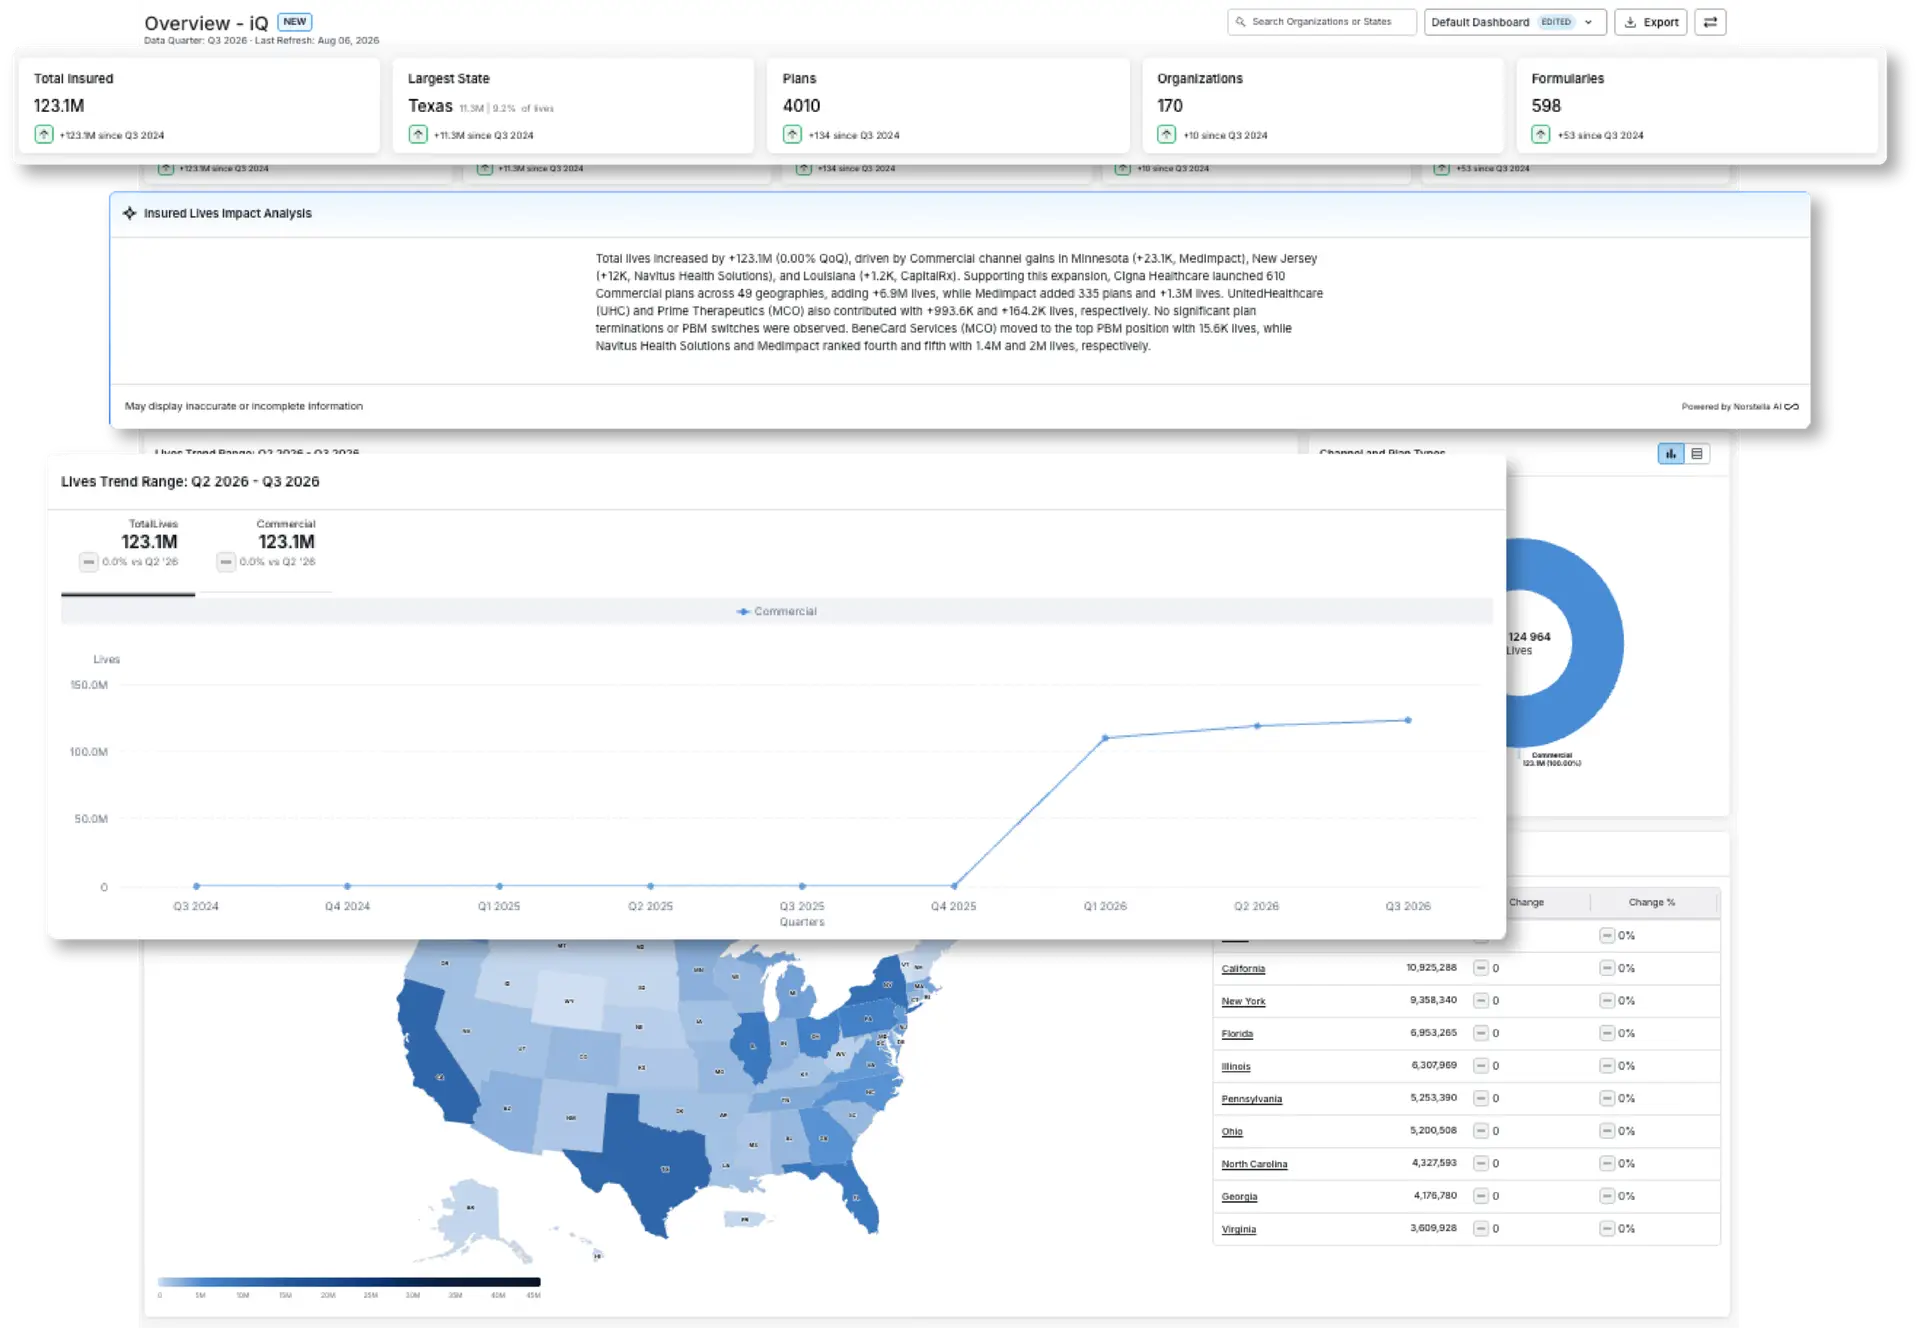
Track 24 Months of Trends with Ella AI
See how enrollment and market dynamics change over time, then use Ella AI to quickly understand what’s driving the shifts for an account or territory.
Track 24 months of history to see where enrollment, accounts, or markets are growing, declining, or shifting.
Use AI-powered summaries to surface the context behind market changes without piecing the story together across multiple data sources.
What Our Clients Are Saying
"One of the things I've already been talking to my CFO and my manager about is that we're going to need more payer data. I can't rely on a ChatGPT query because I know it's suspect and they're pulling from things, and they make stuff up all the time. I want something that I can trust, and I've trusted before and MMIT has checked that box in the past for me. And it's been easy."
SVP, Payor Growth and Strategy
Small Healthcare IT Company
“This kind of ecosystem visibility is usually really in the weeds but Landscape iQ makes it usable—and helps us ask more compelling questions of payers.”
Director of Market Access, National Accounts
Pharma Company
“ASO lives give our Account Directors a clearer view of where opportunity sits, helping the sales force focus on the right opportunities in their territories — not the distractions.”
Sr. National Rare Disease Director
Pharma Company
“The AI summaries are transformational in helping us understand the ‘why’ behind market shifts. Today, we spend a lot of time figuring that out on our own.”
Regional Account Director
Pharma Company
How We Can Help
Landscape iQ combines market visibility, relationship intelligence, and connected insights in one experience built to help teams size opportunity, understand influence, and respond faster to change across the payer ecosystem.
Landscape iQ combines enrollment, payer relationships, plan detail, geography, and organizational intelligence into one connected experience, giving teams a clearer view of who drives access and how the market is changing.
Teams can explore deeper lives segmentation, including ASO, fully insured, LIS, and dual eligible populations, track market shifts over time, and identify the organizations and relationships that influence coverage and reimbursement decisions.
Interactive dashboards, connected market views, AI-powered summaries, and engagement-ready intelligence help teams quickly identify opportunities, respond to market change, and align commercial decisions with organizations that shape access.

In-Depth Payer Profiles
Access dozens of payer profiles and in-depth narratives, focused on top health plans, PBMs and all 50 U.S. states. Put our research to work for you.